Stop overbuying pixels: Cambridge University study reveals when 4K and 8K stop mattering
Last Updated on October 29, 2025 by David
If you’ve ever wondered whether a 4K or 8K TV actually makes your viewing experience better, Cambridge researchers have a refreshingly practical answer!
A new study from the University of Cambridge and Meta Reality Labs measured the resolution limit of the human eye using pixels per degree (PPD) – a “how it looks from your sofa” metric rather than a raw pixel spec.
The punchline? Beyond a certain point, extra pixels don’t add visible detail, they just add cost and power use.
Why this matters now:
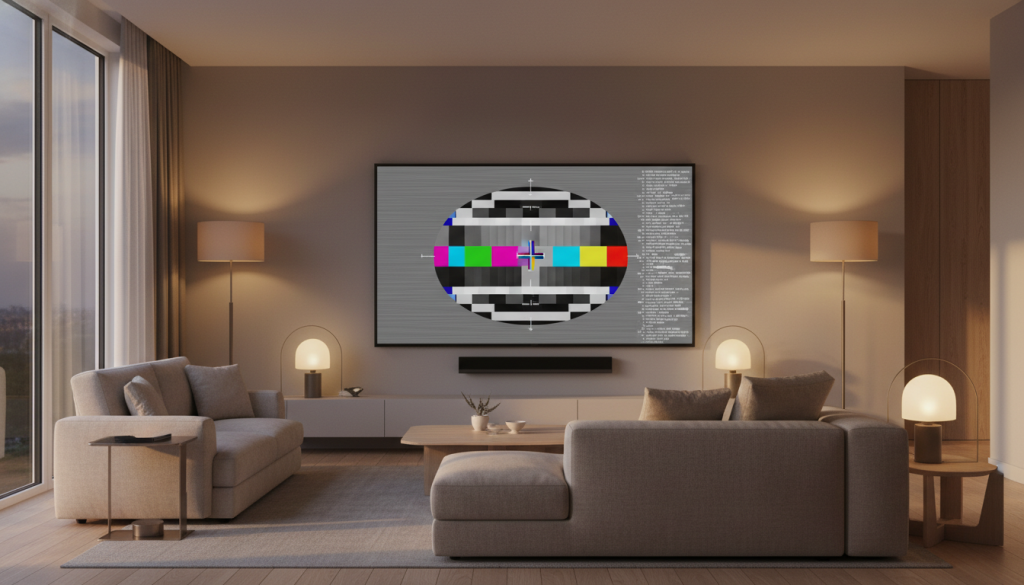
Device makers are racing to cram more pixels into TVs, phones, VR headsets, and car dashboards. But the study shows what our vision can really resolve depends on screen size, viewing distance, room lighting, and whether you’re seeing greyscale or color. In an average UK living room with a 2.5 m viewing distance, a 44-inch 4K or 8K set offers no perceptible benefit over a – significantly cheaper – Quad HD (QHD) display of the same size. Yes, really.
What’s noteworthy:
The team found the eye’s limit is higher than the textbook 60 PPD often cited. They measured around 94 PPD for greyscale straight ahead, ~89 PPD for red/green, and ~53 PPD for yellow/violet, with performance dropping further in peripheral vision. That color gap is key: our brains simply don’t extract fine color detail as well as luminance detail, especially off-center.
“As large engineering efforts go towards improving the resolution of mobile, AR and VR displays, it’s important to know the maximum resolution at which further improvements bring no noticeable benefit,” says Dr. Maliha Ashraf, first author of the study from Cambridge’s Department of Computer Science and Technology.
Test it yourself!
They built a free online calculator so you can enter your room and TV details to see what resolution actually makes sense for you. Smart for buyers – and a “north star” for display engineers working on imaging, rendering, and video coding.
Check out the full article for the methodology, PPD charts, and the calculator link: University of Cambridge news release and the paper in Nature Communications. Try the team’s free display calculator here: Display resolution tool.